Overview of the minixcali package
Baptiste Auguié
2024-03-31
Source:vignettes/Overview.Rmd
Overview.Rmd
The Excalidraw format
Excalidraw can import and export its scenes in json; the format
consists of 5 top-level entries, of which the important one is
elements, which is an array containing the description of
each basic glyph in the scene.
{
"type": "excalidraw",
"version": 2,
"source": "https://excalidraw.com",
"elements": [
{
"type": "rectangle",
"fillStyle": "solid",
[...]
"groupIds": []
},
{
"type": "rectangle",
"fillStyle": "solid",
[...]
"groupIds": []
}
],
"appState": {
"viewBackgroundColor": "#ffffff",
"gridSize": null
}
}
Note that there doesn’t appear to be a device size / viewport / viewbox. I’m also unsure what the units are; looking at the SVG export it seems to be the same default “px”, i.e. 1/96th of an inch, i.e. about a quarter of a mm.
Elements
- “type”: “rectangle” or “ellipse” or “draw” or “text”. There’s also “line” and “arrow” but the difference is only relevant for the user interface.
Most attributes are pretty straight-forward,
- “fillStyle”: “solid” or “hatch” or “cross-hatch”
- “strokeWidth”: 1 or 2 or 4
- “strokeStyle”: “solid” or “dashed” or “dotted”
- “roughness”: 0 or 1 or 2 # degree of wiggliness
- “opacity”: 0 to 100
- “angle”: in radians
- “x”: -156 # the origin appears to be the centre of the page?
- “y”: -80 # units seem more or less like SVG’s px
- “strokeColor”: “#000000” # html codes
- “backgroundColor”: “#ced4da”
- “width”: 400
- “height”: 300
- “strokeSharpness”: “sharp” or “round”
The following are for text (but it doesn’t seem to hurt if irrelevant parameters are passed to another shape type),
- “text”: “this is text”
- “fontSize”: 36
- “fontFamily”: 1 # “FG_Virgil.woff2” or 2 for “Cascadia.woff2”
- “textAlign”: “left”
- “verticalAlign”: “top”
- “baseline”: 3
Each glyph is assigned some identification,
- “seed”: 233882977 # to generate unique random variations
- “id”: “3HjMtdwNS5YZdRqmv3BFM” # unique ID, e.g. md5 hash of object
- “groupIds”: [] # array of strings indicating glyph groupings
- “boundElementIds” — ids of (linear) elements that are bound to this element for connected glyphs
Finally the following attributes for collaboration,
- “version”: integer that is sequentially incremented on each change. Currently used to reconcile elements during collaboration or when saving to server.
- “versionNonce”: random integer that is regenerated on each change. Used for deterministic reconciliation of updates during collaboration, in case the versions are identical.
- “isDeleted”: flag to keep track of deletes in collaboration
Creating a simple scene
minixcali defines a very basic R6 class
ExcaliDocument which initialises the 5 top-level nodes of
the json object. Two methods are defined,
-
$add, to add glyphs to theelementsfield -
$export, to save the object to a json file (viajsonlite)
The $add method simply appends glyph(s) to the list of
elements. Each glyph needs to be a well-formed list of attributes, such
as
list(type = "rectangle",
     x = -407.242554, y = 0,
     width = 44, height = 44,
     angle = 0,
     strokeColor = "#495057",
     backgroundColor = "#ced4da",
     fillStyle = "hachure",
     strokeWidth = 1,
     strokeStyle = "solid",
     roughness = 1L,
     opacity = 100L,
     strokeSharpness = "sharp",
     isDeleted = FALSE,
     groupIds = list(),
     boundElementIds = NA,
     id = "2732dc14872d3709d5978813d7bf550c",
     seed = 1260353516L,
     version = 32L,
     versionNonce = 784119031L)
minixcali provides 4 functions
(xkd_rectangle(), xkd_ellipse(),
xkd_draw(), xkd_text()) to generate such lists
from the set of default parameters.
## List of 27
##  $ type           : chr "text"
##  $ x              : num 0
##  $ y              : num 0
##  $ width          : num 100
##  $ height         : num 100
##  $ angle          : num 0
##  $ strokeColor    : chr "#555555"
##  $ backgroundColor: chr "#868e96"
##  $ fillStyle      : chr "solid"
##  $ strokeWidth    : int 2
##  $ strokeStyle    : chr "solid"
##  $ roughness      : int 0
##  $ opacity        : int 100
##  $ groupIds       : list()
##  $ strokeSharpness: chr "sharp"
##  $ isDeleted      : logi FALSE
##  $ boundElementIds: logi NA
##  $ text           : chr "new label"
##  $ fontSize       : int 36
##  $ fontFamily     : int 1
##  $ textAlign      : chr "left"
##  $ verticalAlign  : chr "top"
##  $ baseline       : int 32
##  $ version        : num 1
##  $ versionNonce   : num 12345
##  $ id             : chr "1f9a050f82d6fa104fb83235d82ff816"
##  $ seed           : int 516669426
To create multiple shapes at once it can be useful to create a list
or data.frame of attributes, and use purrr functions to
iterate over them,
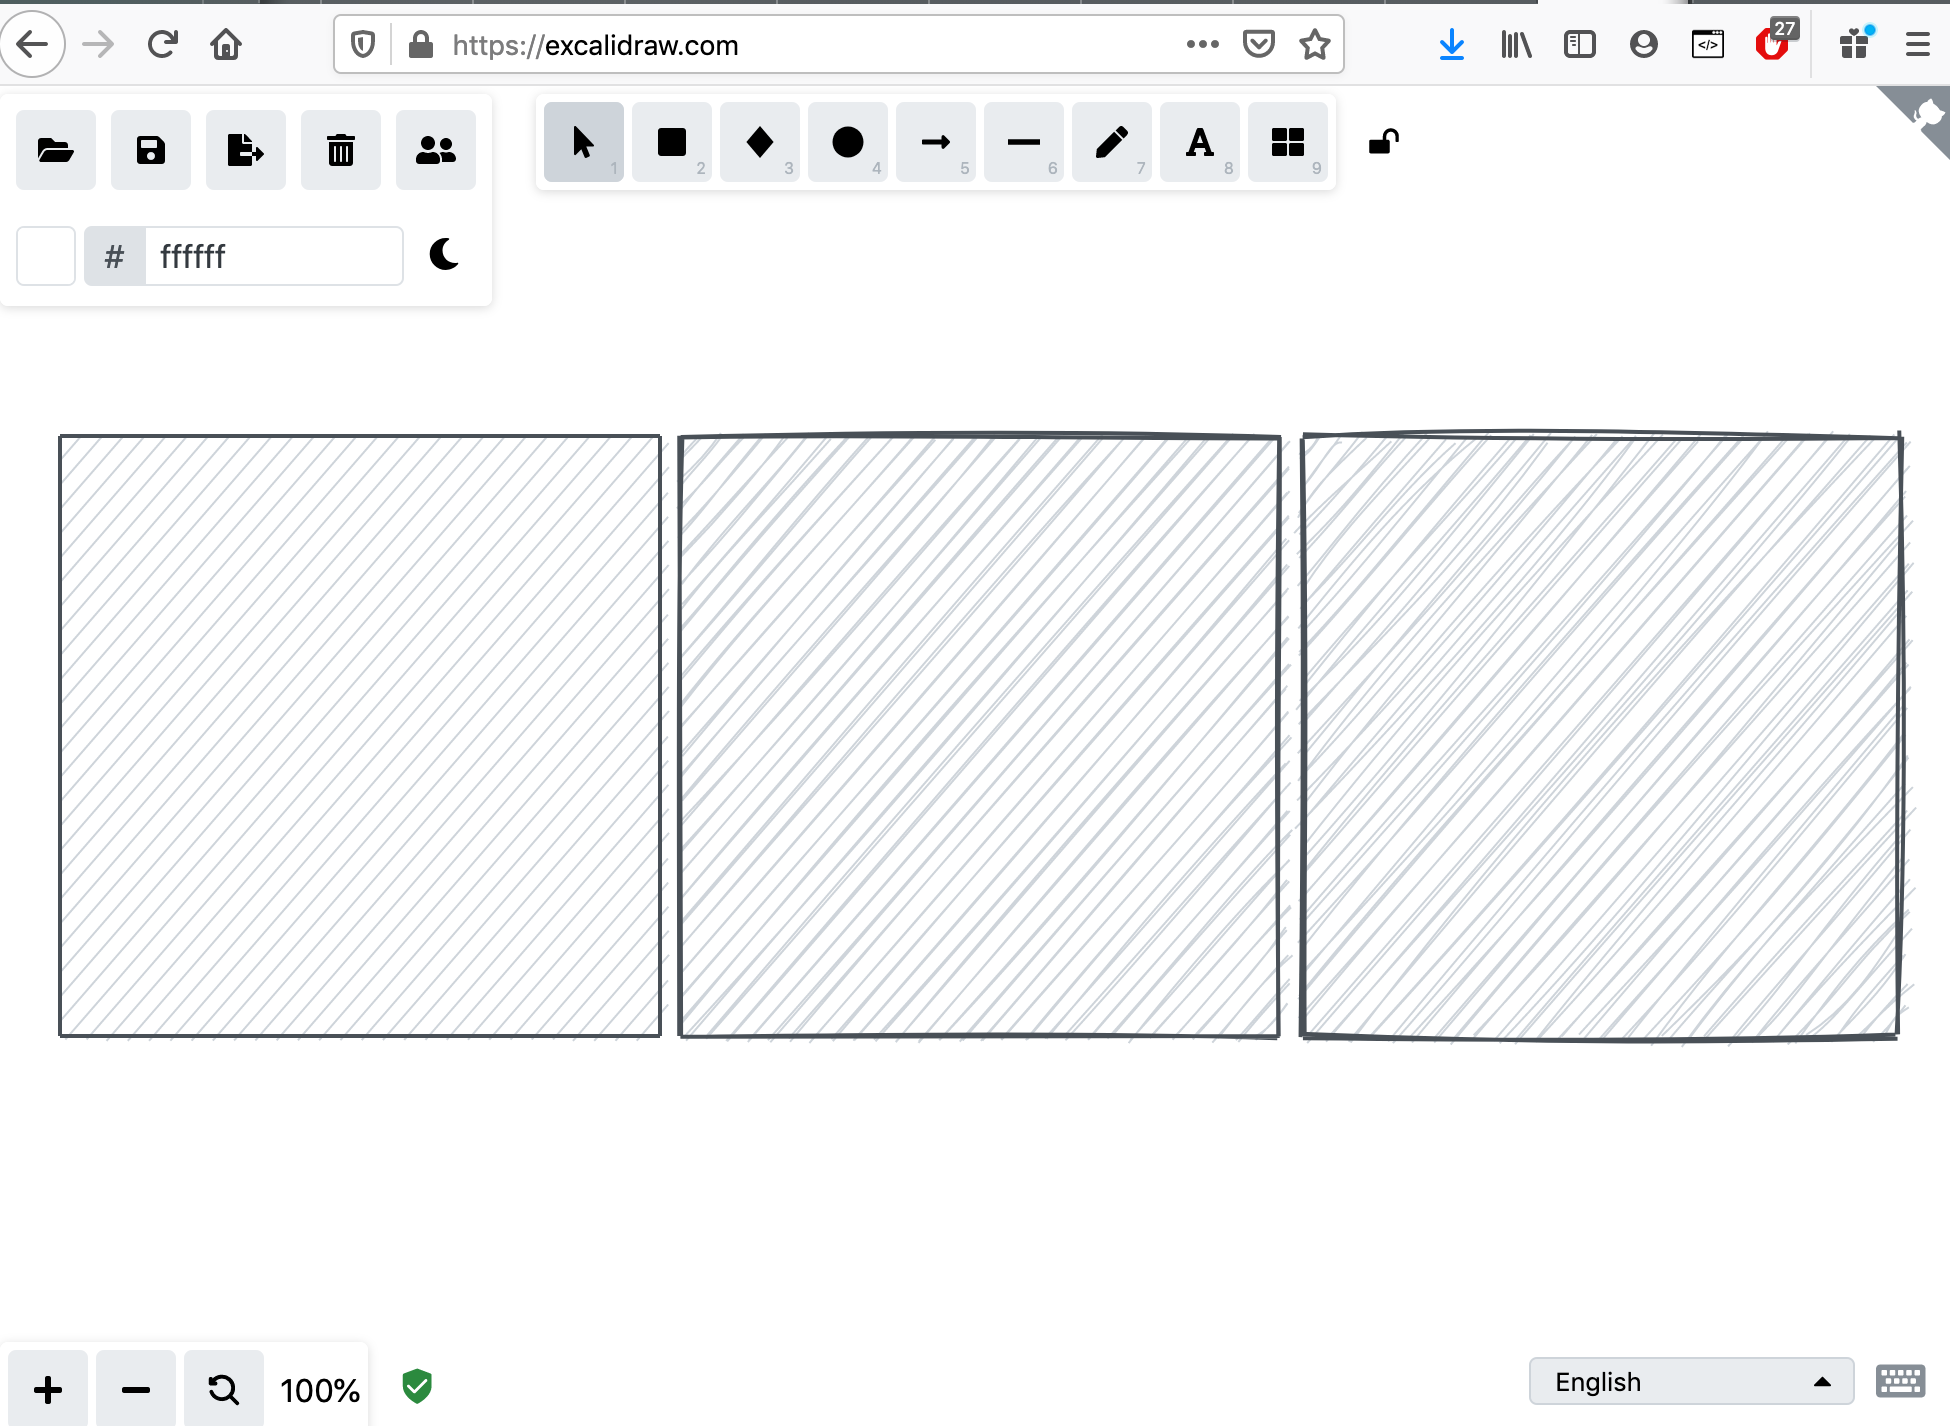
a <- tibble::tribble(~x, ~y, ~width, ~height, ~roughness, ~backgroundColor,
             -300 ,   -80,   300,    300, 0, "#ced4da",
             10 ,   -80,   300,    300, 1, "#ced4da",
             320 ,   -80,   300,    300, 2, "#ced4da")

a$strokeWidth <- 2

d <- Excali_doc()
invoke(d$add, pmap(a, xkd_rectangle))
str(d$elements, max.level = 1)
## List of 3
## $ :List of 21
## $ :List of 21
## $ :List of 21We can the export the full tree to json and open it in Excalidraw,
d$export(file='testing.json')
The drawing may be edited at https://excalidraw.com/#json=5181621544157184,h3q8WL5-2HPBFjkjQeu5RA
Lines
line, arrow and draw elements
(the difference is in the interaction with online tools; there’s none
from the JSON perspective) require a points attribute that
encodes (x,y) node coordinates in an array structure.
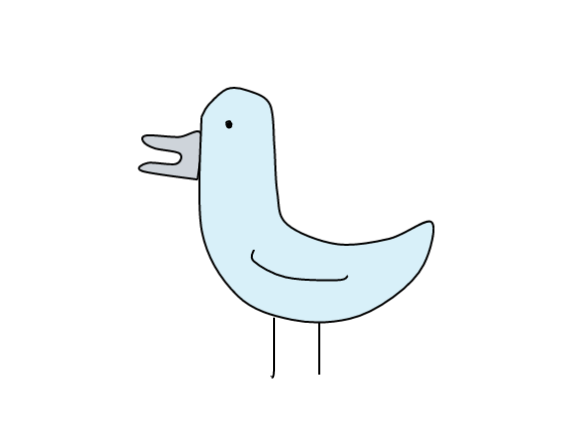
Say we have inherited some (x,y) coordinates representing a polygon
from a drawing program; we can insert them into the points
attribute and from there generate the scene as above. It is also
possible to group multiple paths by giving them a common
group attribute, as illustrated below. The resulting group
can then be edited (moved, rotated, attribute changes, etc.) as one
object in Excalidraw.
source(system.file("samples/pdl.R", package = "minixcali"))

str(.kevin) # stored coords in the package under data/
## List of 6
## $ :List of 7
## ..$ x : num -3.14
## ..$ y : num 128
## ..$ width : num 29.5
## ..$ height : num 22.8
## ..$ backgroundColor: chr "#ced4da"
## ..$ strokeColor : chr "#000000"
## ..$ points : num [1:11, 1:2] -11.4 -39 -36.2 -22.2 -20.4 ...
## $ :List of 7
## ..$ x : num -13.2
## ..$ y : num 92.9
## ..$ width : num 115
## ..$ height : num 115
## ..$ backgroundColor: chr "#d8f0f9"
## ..$ strokeColor : chr "#000000"
## ..$ points : num [1:18, 1:2] 0 0.26 18.2 45.32 73.92 ...
## $ :List of 7
## ..$ x : num -0.922
## ..$ y : num 104
## ..$ width : num 2.6
## ..$ height : num 2.83
## ..$ backgroundColor: chr "#000000"
## ..$ strokeColor : chr "#000000"
## ..$ points : num [1:8, 1:2] 0 0.694 2.256 2.604 2.083 ...
## $ :List of 7
## ..$ x : num 41.5
## ..$ y : num 187
## ..$ width : num 1.45
## ..$ height : num 29.6
## ..$ backgroundColor: chr "#ced4da"
## ..$ strokeColor : chr "#000000"
## ..$ points : num [1:3, 1:2] -18.6 -18.6 -20 0 26.8 ...
## $ :List of 7
## ..$ x : num 45.6
## ..$ y : num 189
## ..$ width : int 0
## ..$ height : num 26
## ..$ backgroundColor: chr "#ced4da"
## ..$ strokeColor : chr "#000000"
## ..$ points : num [1:2, 1:2] 0 0 0 26
## $ :List of 7
## ..$ x : num 13.1
## ..$ y : num 153
## ..$ width : num 47
## ..$ height : num 15.2
## ..$ backgroundColor: chr "#ced4da"
## ..$ strokeColor : chr "#000000"
## ..$ points : num [1:5, 1:2] 0 0 15.9 41.9 47 ...
d <- Excali_doc()

for (l in .kevin) {
  call <- c(l,
    list(
      groupIds = list(list("kevin")),
      strokeSharpness = "round",
      fillStyle = "solid",
      strokeWidth = 1L,
      roughness = 0L
    )
  )

  shape <- invoke(xkd_draw, call)
  d$add(shape)

}

d$export('drawing.json')
Drawing at https://excalidraw.com/#json=5903088405708800,72BcP2Ry6NHWbHEUpidg9w
