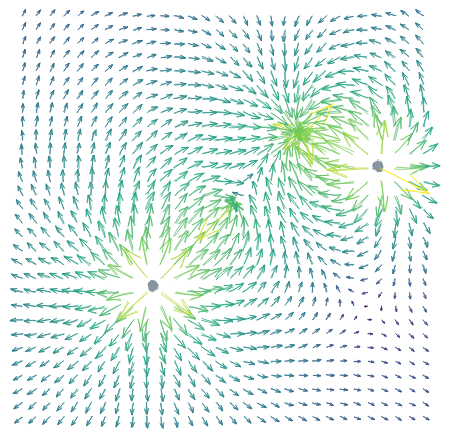
Let’s simulate the electric field of a few points charges,

We can extract the data from the geom_segment plot layer
## 'data.frame':    900 obs. of  10 variables:
##  $ colour   : chr  "#2C768E" "#2A788E" "#2A7A8E" "#2B7C8D" ...
##  $ x        : num  -0.87 -0.778 -0.686 -0.594 -0.502 ...
##  $ y        : num  -0.87 -0.87 -0.87 -0.87 -0.87 -0.87 -0.87 -0.87 -0.87 -0.87 ...
##  $ xend     : num  -0.883 -0.791 -0.699 -0.606 -0.513 ...
##  $ yend     : num  -0.88 -0.882 -0.884 -0.886 -0.888 ...
##  $ PANEL    : Factor w/ 1 level "1": 1 1 1 1 1 1 1 1 1 1 ...
##  $ group    : int  -1 -1 -1 -1 -1 -1 -1 -1 -1 -1 ...
##   ..- attr(*, "n")= int 1
##  $ linewidth: num  0.5 0.5 0.5 0.5 0.5 0.5 0.5 0.5 0.5 0.5 ...
##  $ linetype : num  1 1 1 1 1 1 1 1 1 1 ...
##  $ alpha    : logi  NA NA NA NA NA NA ...
## List of 900
## $ 1 :'data.frame': 1 obs. of 10 variables:
## ..$ colour : chr "#2C768E"
## ..$ x : num -0.87
## ..$ y : num -0.87
## .. [list output truncated]
## $ 2 :'data.frame': 1 obs. of 10 variables:
## ..$ colour : chr "#2A788E"
## ..$ x : num -0.778
## ..$ y : num -0.87
## .. [list output truncated]
## $ 3 :'data.frame': 1 obs. of 10 variables:
## ..$ colour : chr "#2A7A8E"
## ..$ x : num -0.686
## ..$ y : num -0.87
## .. [list output truncated]
## [list output truncated]and add arrows to an Excalidraw scene,
You can see this drawing at: https://excalidraw.com/#json=6202526680481792,xanZkzdhtsKWScXdt28sKQ
